Updated as of November 2024
One of the bedrock principles of RESA and its members is that competition is the most effective means for efficiently allocating resources and directing investment in energy, similar to the market dynamics for other goods and services. RESA also believes that competition among retail energy companies brings benefits to consumers that are not readily provided through traditional utility regulation, including product innovation, improved customer responsiveness, and enhanced opportunities for clean energy.
An introduction and overview of the whitepapers and updated charts based on this work was written by Frank Caliva.
Restructuring Recharged: The Superior Performance of Competitive Electricity Markets
In Restructuring Recharged, originally published in April of 2017 with data from 2008 to 2016, Dr. O’Connor begins with a history of the restructuring of the electric power industry. He then takes us from this history into the empirical evidence (predominantly based on EIA data) with a review of the price divergence between restructured and traditional monopoly states, the attraction of investment capital, and the performance of merchant generation facilities in both types of jurisdictions. His conclusions are compelling as he explains the superior performance of customer choice policies and the unsustainability of the monopoly model in a world in which technological innovation is driving down demand for electricity and requiring investment to adapt to this constant change.
Top 3 Charts from Restructuring Recharged:
(Updated with the latest data available as of September 2024)

Figure 3 – 14 Customer Choice Jurisdictions
These 14 competitive jurisdictions shown in green (13 states plus Washington DC) account for one-third of U.S. electricity power production and consumption. The designation of “competitive jurisdiction” in this paper is defined as a jurisdiction that:
- Enables nearly all classes of customers to be able to choose a retail supplier without cumbersome restrictions or limitations, and;
- The utilities in these jurisdictions have divested all (or nearly all) of their generation assets and are primarily wires-only delivery service companies. Consequently, the generating assets in these states are not included in the rate base of these delivery service utilities. Therefore, they compete within the wholesale power market parameters in place for business revenues.
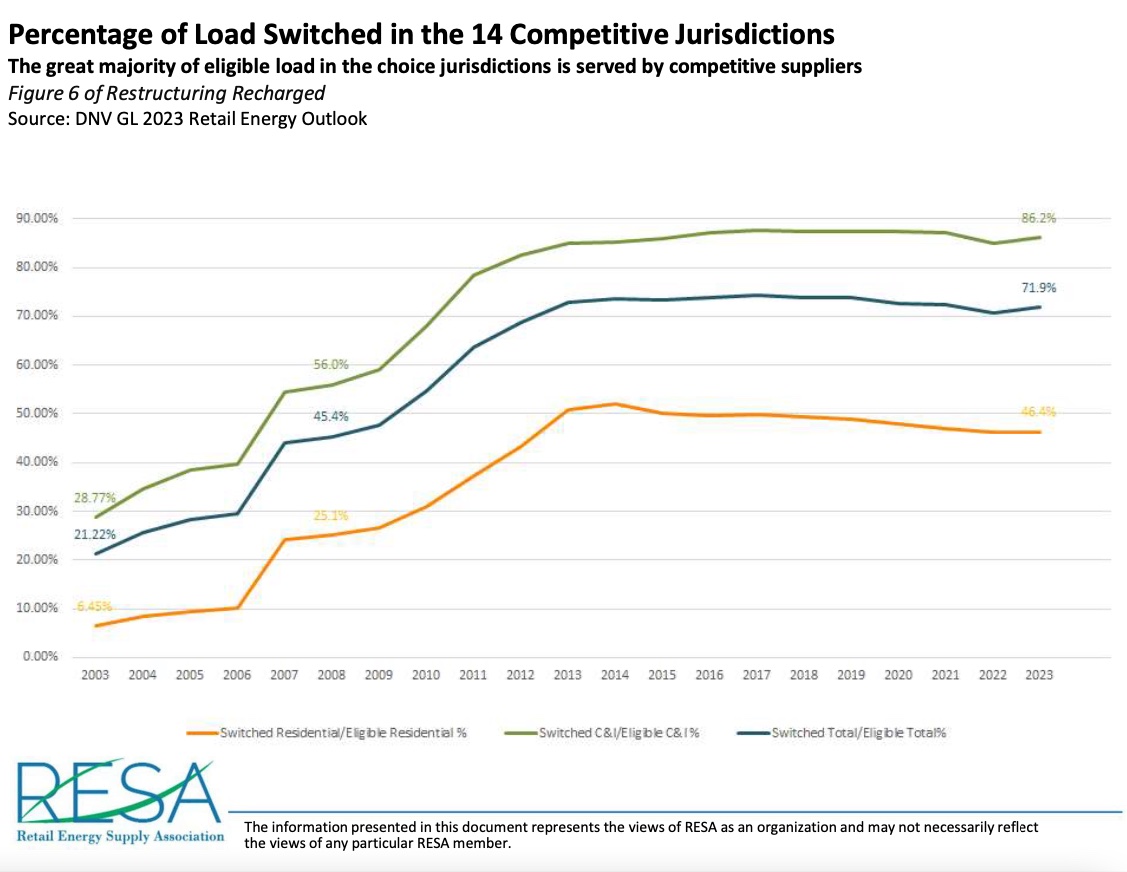
Figure 6 – Percentage of Load Switched in the 14 Competitive Jurisdictions
This figure shows the upward trend in shopping activity from residential and C&I customers concerning load served by non-utility suppliers.*1 In 2023, 71.9% of the load eligible to switch in the 14 customer choice markets was served competitively with retail pricing and products by non-utility suppliers. Interestingly, most C&I load (86.2%) has switched to non-utility supply. Meanwhile, less than half (46.4%) of the residential load in the competitive jurisdictions had switched to supply procured by retail suppliers. Most of the remaining load in the 14 markets, a little less than one-third of the total eligible load in those jurisdictions, is served with market-priced supply procured in the competitive wholesale market by wires utilities acting as default providers.
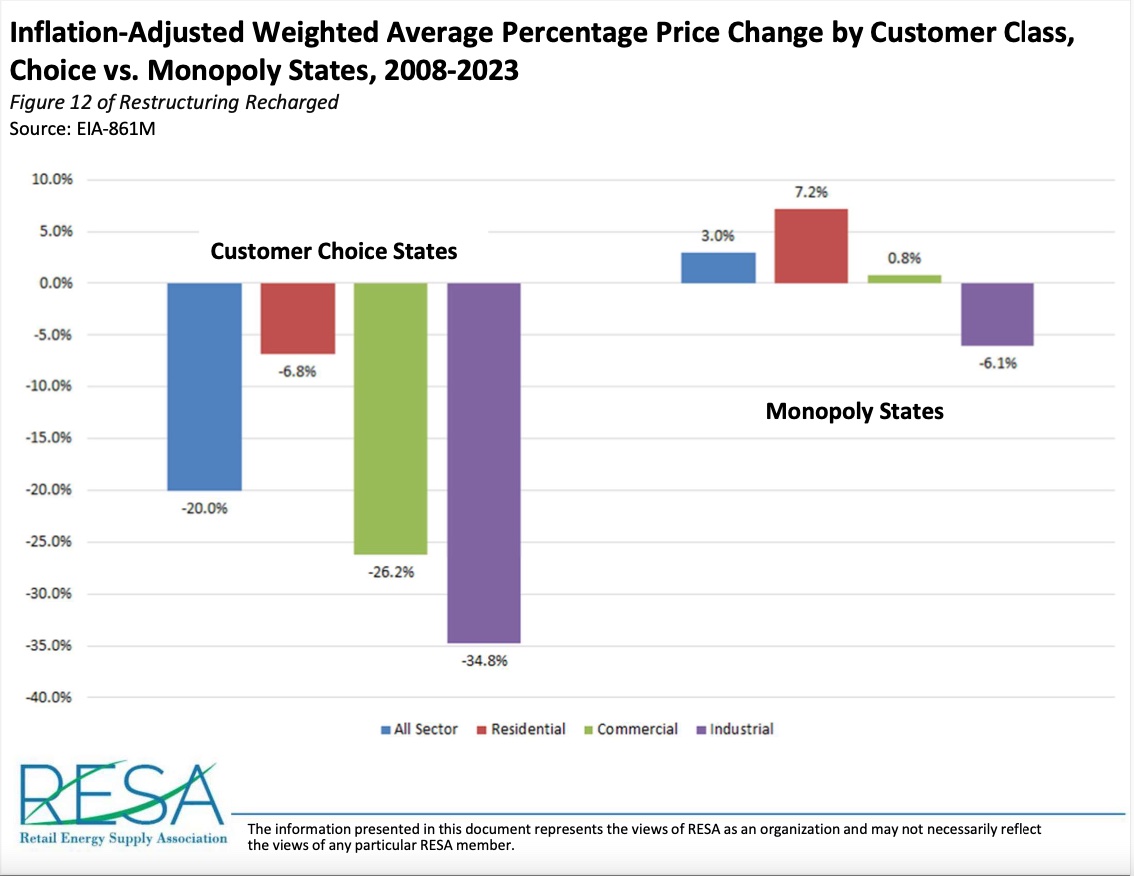
Figure 12 – Inflation-Adjusted Weighted Average Percentage Price Change by Customer Class, Choice vs. Monopoly States, 2008-2023
The difference in risk allocation between monopoly and choice regimes is manifested most clearly in the divergent electricity price trends during the flat-load era since 2008. This figure shows the aggregate inflation-adjusted percentage changes in weighted average prices of delivered supply for the groups of 14 choice jurisdictions and the 35 monopoly states from 2008 through 2023. It also shows stunningly different price trends in the competitive jurisdictions compared to the monopoly states from 2008 through 2023. The inflation-adjusted weighted average prices in the group of 35 monopoly states have risen moderately concerning inflation, except for Industrial, which has decreased slightly. By contrast, in the 14 competitive markets, residential, commercial, and industrial inflation-adjusted weighted average prices have each dropped significantly.
In addition to the three figures from Restructuring Recharged updated above, Figures, 4, 5, 7-11, 13-20, and 22-25 have also been updated and made available here. Download all updated charts from Restructuring Recharged
The Great Divergence in Competitive and Monopoly Electricity Price Trends
In The Great Divergence, originally published in September of 2018, Dr. O’Connor examines electricity price data across the United States in both competitive and regulated monopoly states and across a decade of time to reach a compelling set of conclusions. The insight from this paper is that by looking past price comparisons between or within particular states (or within particular years), a more profound trend emerges: states that rely on regulated monopoly power supply service have seen prices rise over time at a far steeper rate than those states that restructured to adopt competitive retail choice. In other words, regardless of the experience of any individual customer at any particular point in time, the states that made the decision to implement competition achieved a significantly lower weighted average cost of electricity than if they continued to rely upon a regulated monopoly structure. The paper refers to this startling trend as “The Great Divergence.”
Top 3 Charts from The Great Divergence:
(Updated through latest data available as of September 2024)

Figure 2 – All-Sector Weighted Average Percentage Price Change, Choice vs. Monopoly States, 2008-2023
U.S. Energy Information Administration (EIA) data allow for comparing trends in weighted average nominal prices between the monopoly group of states and the competitive jurisdictions. The All-Sector annual weighted average price in the 35 monopoly states was 43.6% higher in 2023 than in 2008. In contrast, the All-Sector annual weighted average price for the competitive retail markets was only 11.5% higher than in 2008.
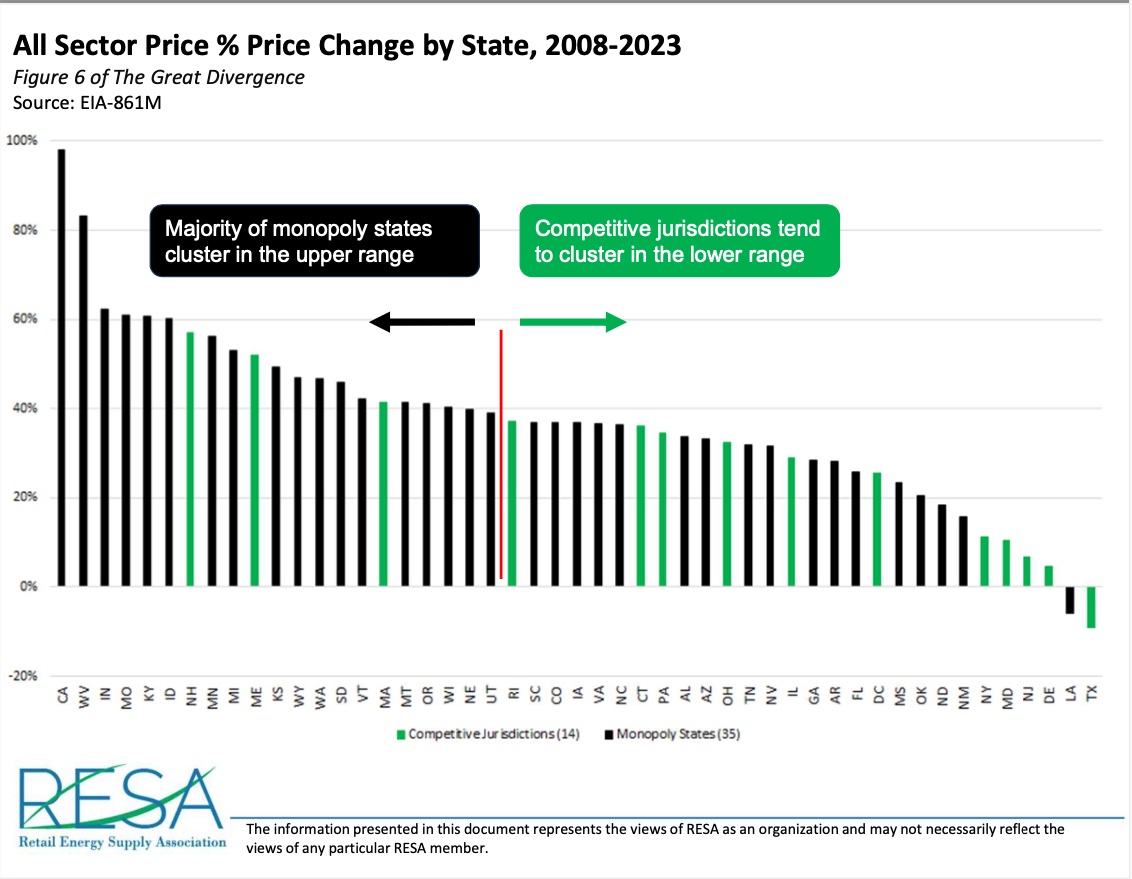
Figure 6 – All Sector Price % Price Change by State, 2008-2023
The significant difference in percentage changes in weighted average prices between the monopoly and competitive choice jurisdictions is not the result of a few large states skewing the results in one direction. Instead, when the states are ranked by the percentage change in each state’s average All-Sector price change over this period, the competitive states tend to cluster in the lower range, and the monopoly states tend to occupy the higher parts of the rankings.

Figure 12 – Change in Capacity Factor, 1997, 2008, and 2022 (Generation Output/Potential Output)
The “Capacity Factor” refers to the measurement of how often plants are operated at maximum output. In part, the explanation of the Great Divergence in price performance between the monopoly states and competitive jurisdictions is found in trend lines seen on this figure. While the capacity factors of both state groupings show a decline in capacity factor (due primarily to the deployment of renewable generation assets), the competitive jurisdictions have responded to this trend more cost effectively than have the monopoly states. The decline in the power plant portfolio capacity factor has been larger, both nominally and proportionally, in the 35 monopoly states than in the 14 competitive states/jurisdictions, as shown in this figure (note however, the increased negative slope of the black dotted line compared to the green dotted line).
In addition to the three figures from The Great Divergence updated above, all figures have also been updated and made available here. Download all the updated charts from The Great Divergence
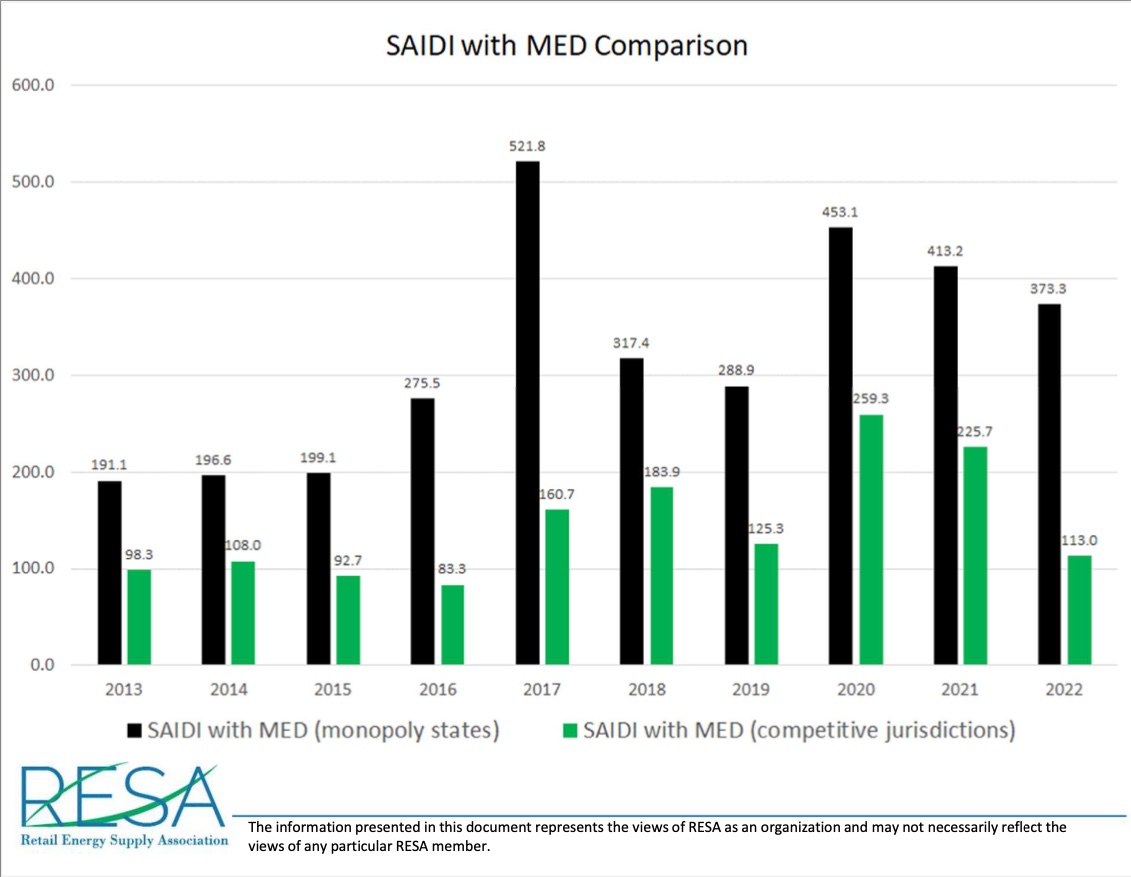
Customer Reliability Analysis
General Definitions:
SAIDI – System Average Interruption Duration Index. SAIDI is the average number of minutes a customer is interrupted in a year.
MED – Major Event Days. When the data talks about with or without MED, it means counting or not counting the outage events associated with major events.
Glossary of terms:
SAIDI with MED – Average yearly duration of outages, in minutes, including major event days.
Additional information on the three metrics: (source: WIKI)
The System Average Interruption Duration Index (SAIDI) is commonly used as a reliability indicator by electric power utilities. SAIDI is the average outage duration for each customer served. SAIDI is measured in units of time, often minutes or hours. It is usually measured over a year, and according to IEEE Standard 1366-1998, the median value for North American utilities is approximately 1.50 hours.
Utility Financial Performance Comparison
Some opponents of restructured markets claim that the consequences of introducing competition and allowing customers to choose their electric supplier will harm or negatively impact the financial performance of the utilities involved. However, the history of electric restructuring has not borne out this concern. In states/jurisdictions that have restructured, formerly vertically integrated utilities have continued to hold strong credit ratings and provide investors with returns on equity substantially equal to those utilities that have retained monopoly status (albeit at times on smaller rate-bases post-divestiture of generation assets). To support this conclusion, RESA obtained both the most recent credit ratings and returns on equity figures from the S&P Global MI database and grouped the data into two categories: (1) utilities in states/jurisdictions that enable retail choice, and (2) those utilities in states that do not. From there, RESA created an average for each state and for each category and compared these two metrics (credit rating and return on equity) side-by-side. Upon examination of this data, it is clear that both credit rating and returns on equity are nearly identical across both categories.
Reductions in Emissions Attributable to Electric Generation
The latest EIA data demonstrates little discernable difference between the decrease in CO₂, SO₂, and NOₓ emissions attributable to electric generation in the 14 competitive states/jurisdictions compared to the 35 monopoly states. This is noteworthy because a common argument is without securitization payments to vertically integrated monopolies as an incentive to shutter their carbon-emitting power plants, carbon emission reductions will not happen as rapidly. However, these graphs demonstrate that market-based forces in the competitive states/jurisdictions (in combination with state and national sustainability policies) are more than adequate to cause reductions in emissions caused by electric power generation.
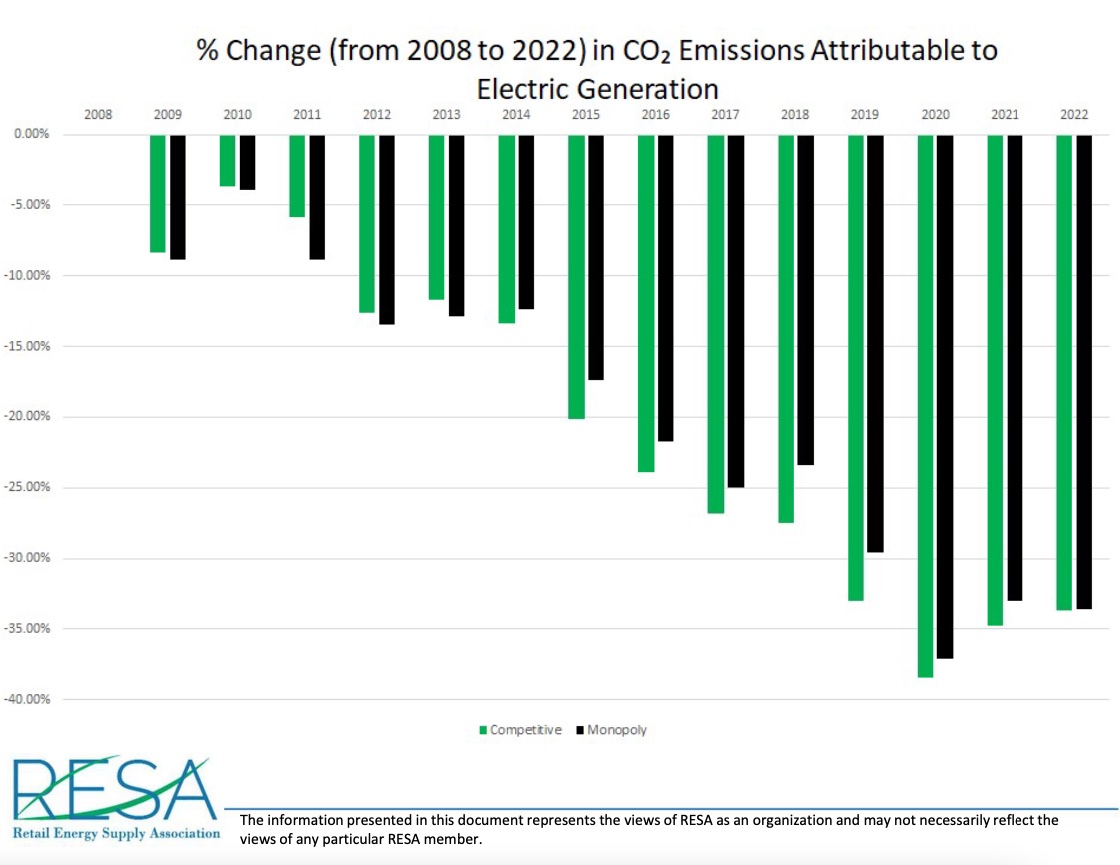
Percent Change in CO2 Emissions Attributable to Electric Generation
This information demonstrates that there is little discernable difference between the decrease in CO2 emissions attributable to electric generation in competitive jurisdictions as compared to monopoly states. This is noteworthy because a common argument is that without securitization payments* to a vertically- integrated monopoly as an incentive to shutter their carbon-emitting power plants, carbon emission reductions will not happen as rapidly. Additionally, competitive power markets are achieving this level of carbon reduction without providing a guaranteed rate of return on renewable assets, as are afforded to the IOUs in monopoly states. This data demonstrates that the market-based forces are equally effective at lowering carbon emissions without resorting to these two characteristics of the monopoly model.
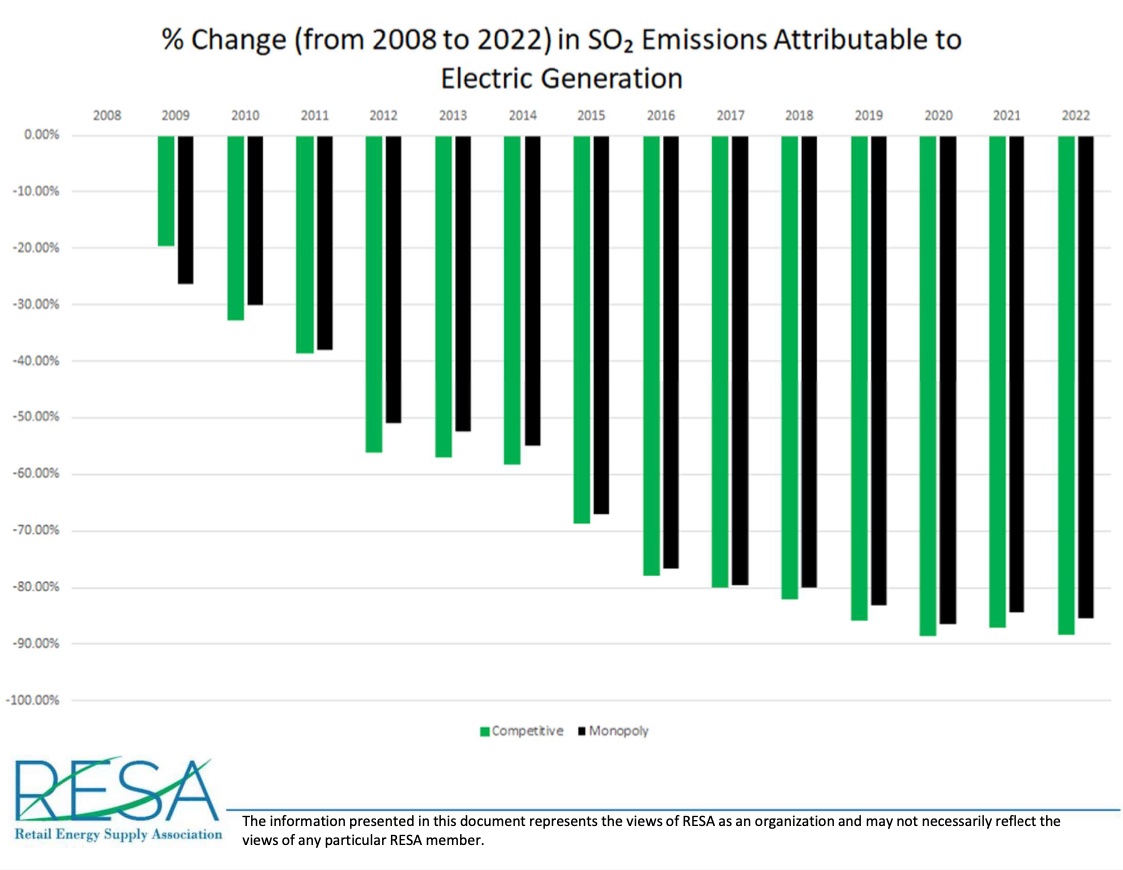
Percent Change in SO2 Emissions Attributable to Electric Generation
This information demonstrates that there is little discernable difference between the decrease in SO2 emissions attributable to electric generation in competitive jurisdictions as compared to monopoly states. This is noteworthy because a common argument is that without securitization payments* to a vertically- integrated monopoly as an incentive to shutter their carbon-emitting power plants, carbon emission reductions will not happen as rapidly. Additionally, competitive power markets are achieving this level of carbon reduction without providing a guaranteed rate of return on renewable assets, as are afforded to the IOUs in monopoly states. This data demonstrates that the market-based forces are equally effective at lowering carbon emissions without resorting to these two characteristics of the monopoly model.

Percent Change in NOx Emissions Attributable to Electric Generation
This information demonstrates that there is little discernable difference between the decrease in NOx emissions attributable to electric generation in competitive jurisdictions as compared to monopoly states. This is noteworthy because a common argument is that without securitization payments* to a vertically- integrated monopoly as an incentive to shutter their carbon-emitting power plants, carbon emission reductions will not happen as rapidly. Additionally, competitive power markets are achieving this level of carbon reduction without providing a guaranteed rate of return on renewable assets, as are afforded to the IOUs in monopoly states. This data demonstrates that the market-based forces are equally effective at lowering carbon emissions without resorting to these two characteristics of the monopoly model.
In addition to the three figures from Reductions in Emissions Attributable to Electric Generation updated above, all figures have also been updated and made available here. Download all the updated charts from Reductions in Emissions Attributable to Electric Generation.
